

Sommaire
Pour aller plus loin
Téléchargez notre ressource :
To develop your growth, it is imperative to master the management of your IT service company perfectly. To do this, your dashboard is the ideal co-pilot that provides you with precise tracking of your performances and essential visibility for decision-making. What if you made the dashboard the engine of your success?
Visualization of your data is one of the major factors for the growth of your IT service company. Similarly, having a long-term vision can help you set goals, appreciate your successes, and identify areas for improvement.
A dashboard tailored to the management of your company
Setting up a dashboard that's efficient for an IT service company is not a mere option but a necessity. It should be designed to meet the specific needs of your sector, combining financial, administrative, commercial, and HR indicators. This tool allows you to measure operational efficiency and adjust the course in response to market fluctuations.
A well-designed dashboard provides an overview and facilitates understanding the health of your IT service company. It should stimulate the reactivity and ability of managers to solve problems. Moreover, it promotes a culture of performance, essential in a sector as competitive as the digital sector.
Key indicators for effective management
Selecting the right indicators is crucial to ensure the relevance of your dashboard in managing your IT service company. They must align with the strategic objectives of your company and enable real anticipatory capacity.
A balance must be struck between financial and non-financial indicators for a comprehensive view of the company's health. The quality of the collected data is also essential for the dashboard to be a real decision-making tool.
Here are some indicators to follow based on your objectives:
- Turnover: Invoice turnover, Signed turnover...
- Number of candidates: sorted by states, candidates worth monitoring...
- Number of opportunities: sorted by states, opportunities to monitor...
- Number of clients, of prospects...
- Sales and recruitment funnels...
- Number of projects
- Number of current employees, upcoming employees, employees in intercontract
- Achieved goals or goals in progress
- Invoices awaiting payment, issued invoices…
Why Create A Dashboard?
The dashboard will help you to:
- Define and track the strategy of your IT service company
- Evaluate the performance of an activity in real-time
- Conduct a quantitative diagnosis of the situation at a given moment
- Provide decision-making support
- Communicate and collaborate internally
- Anticipate future objectives and project into the future
Why Adopt A Management Software to Handle Your IT Service Company?
The advantages of management software are numerous:
- Collection and automatic processing of your data
- Customization of reports based on your criteria
- Configuration of alerts in case of exceeding or reaching critical thresholds
- Creation of visual dashboards
- Collaborative work through shared access
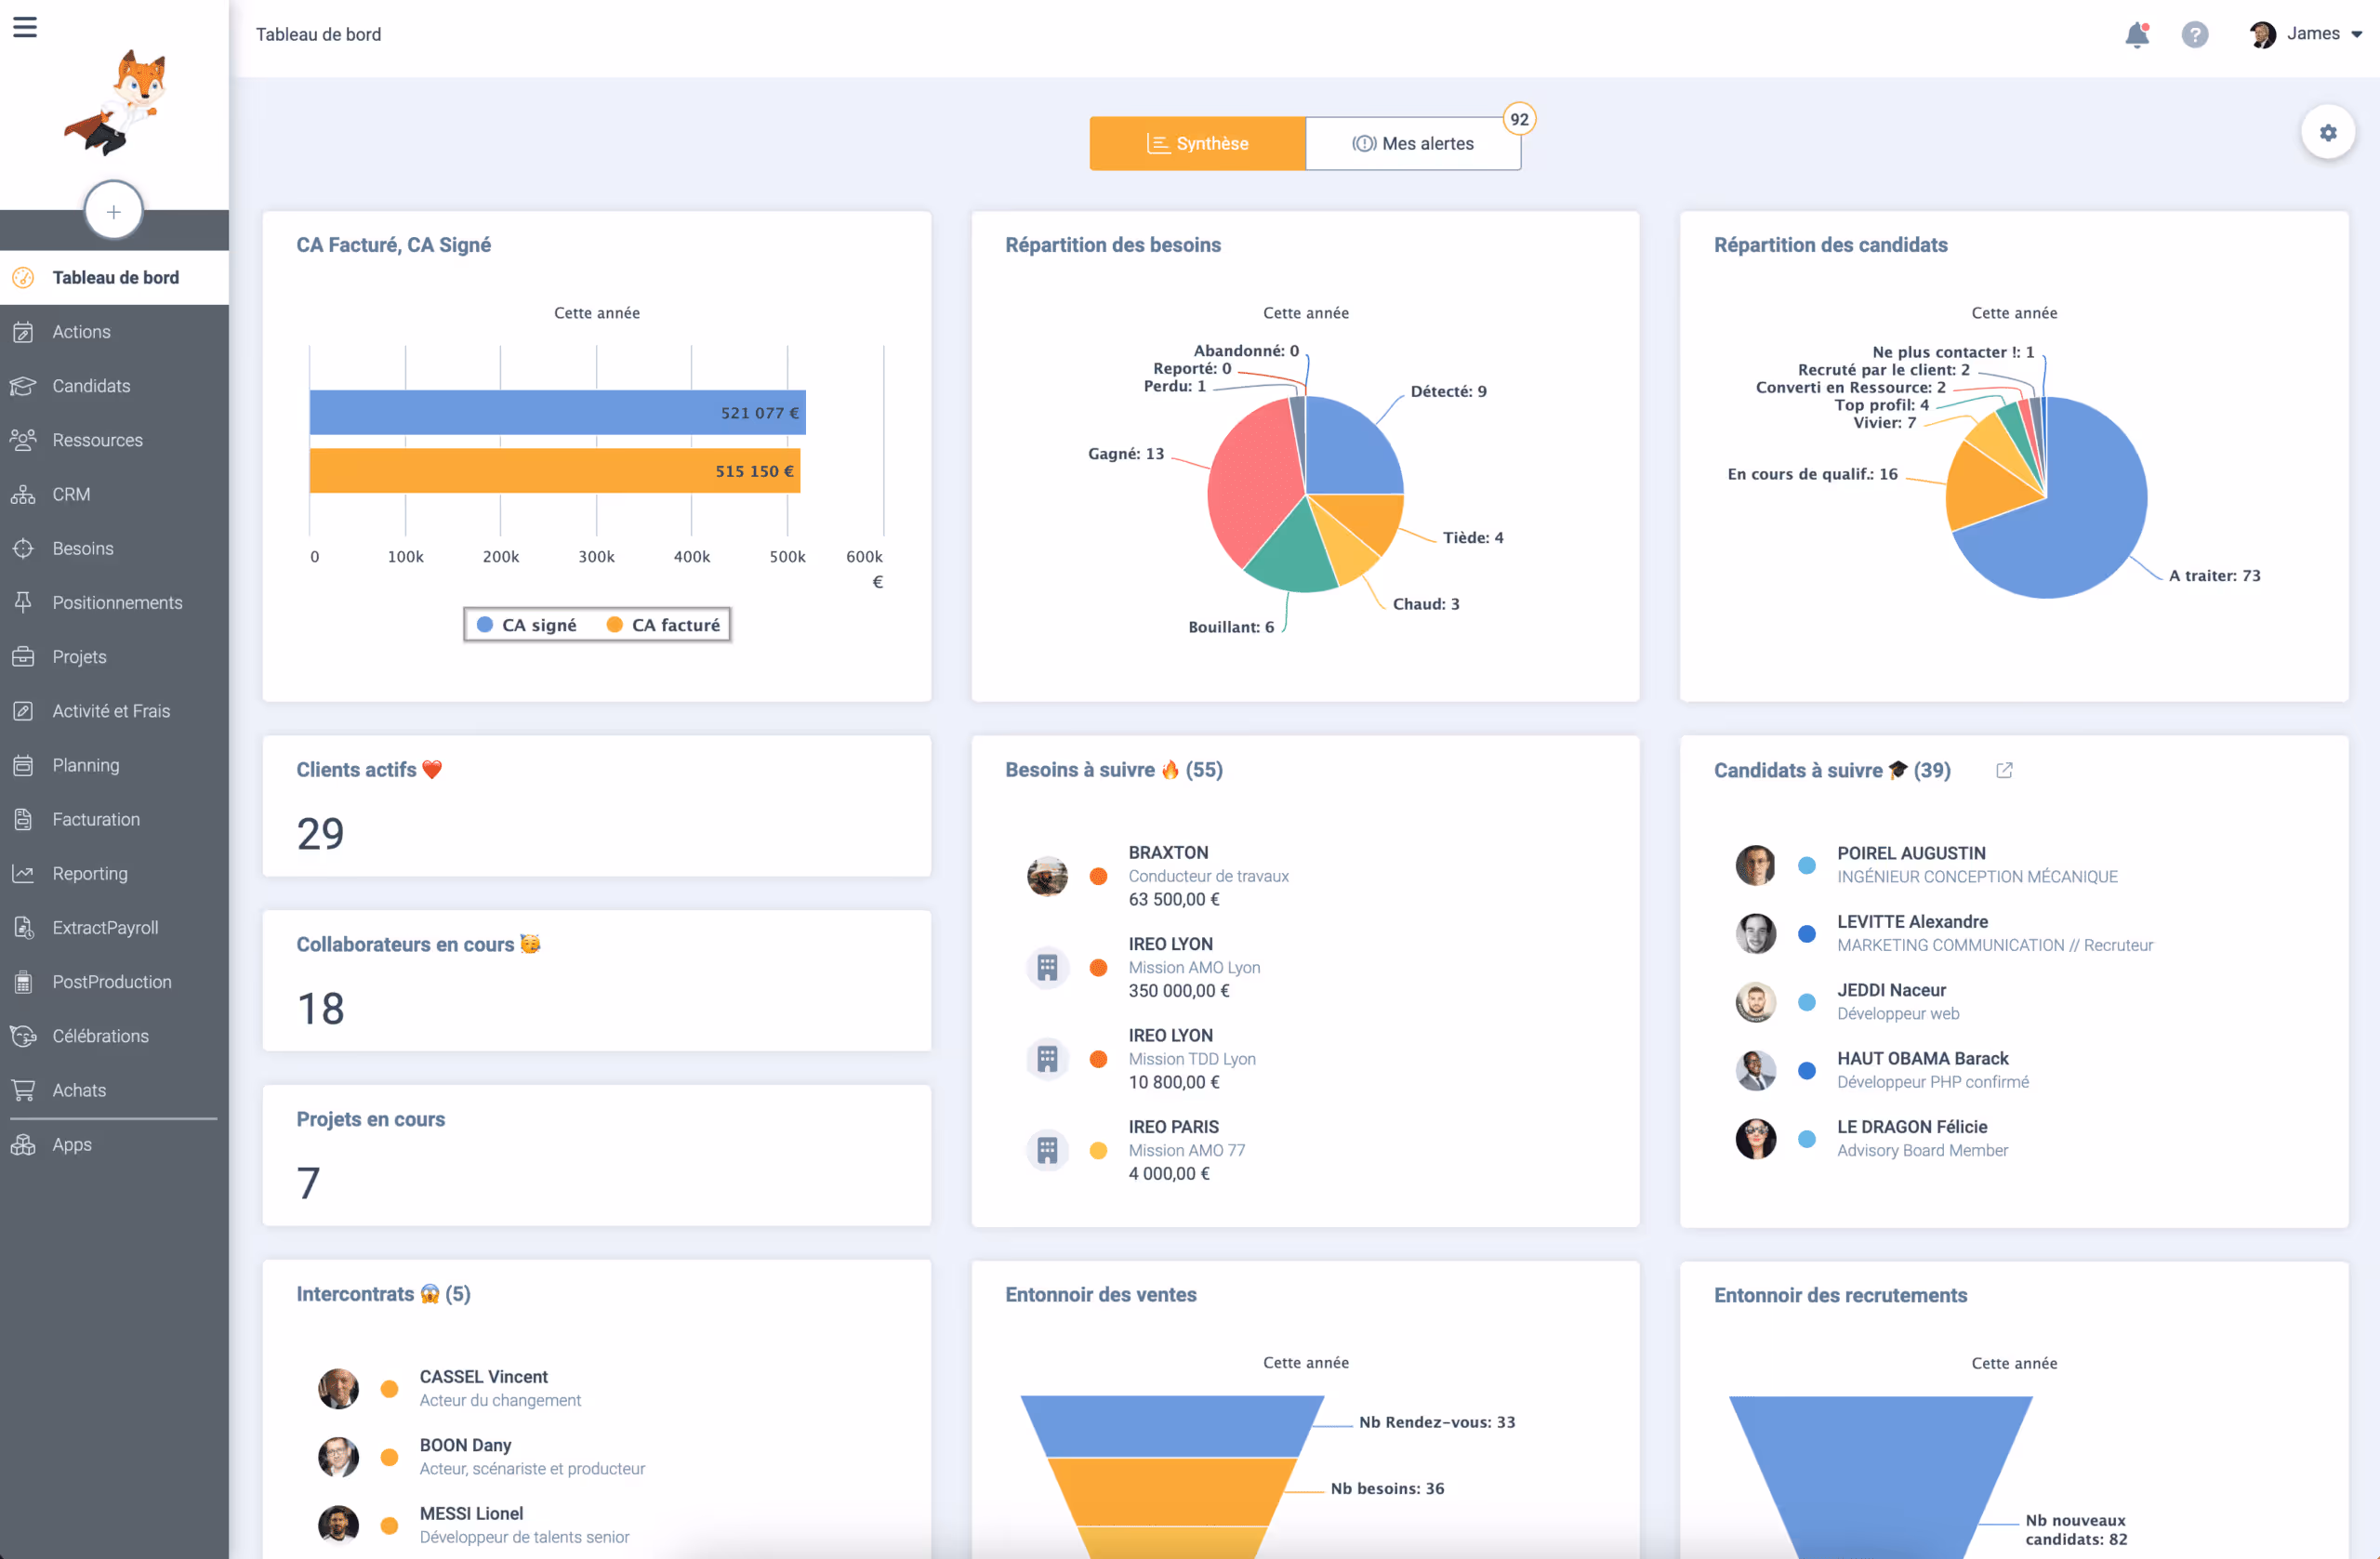
Management of your IT service company via the BoondManager dashboard
At BoondManager, the dashboard is your best ally in the overall management of your activity. You have the choice among 3 types of elements:
- List: Display the results of a search in list form
- Metric: Display the number of results from a search as a numerical counter
- Widget: Display one of our available widgets
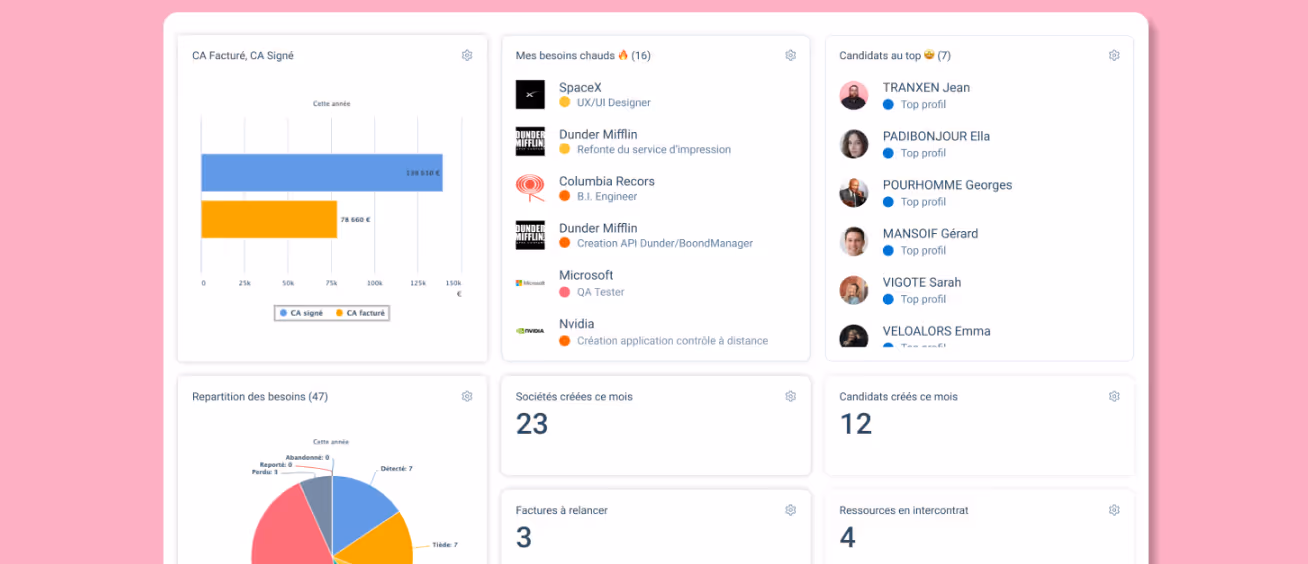
It's easy to customize the content of your dashboard (whether you are an administrator or a user) to better track the indicators that matter to your IT service company.
You can define custom filters for each of your widgets (perimeter, status, type, period, etc.).
You can also edit and customize the titles of your dashboard to match the wording of your company.
Manage Your IT Service Company on Mobile Too!
And to top it off, you also have access to your dashboard from your mobile app to enhance your responsiveness and strategic vision. You can add widgets to your mobile dashboard (for example, widgets on the Actions module with distinct filters) to customize your phone experience and be even more efficient with managing your business.
Moreover, you can compare the displayed data to a previous period to better assess your performance.
Tracking your KPIs has never been easier. And if more than 1,500 IT service companies and consulting firms are already using BoondManager to develop their growth, it's not by chance... 😉
Ressources associées

French IT Service Companies Market: 2023 Overview and 2024 Perspectives
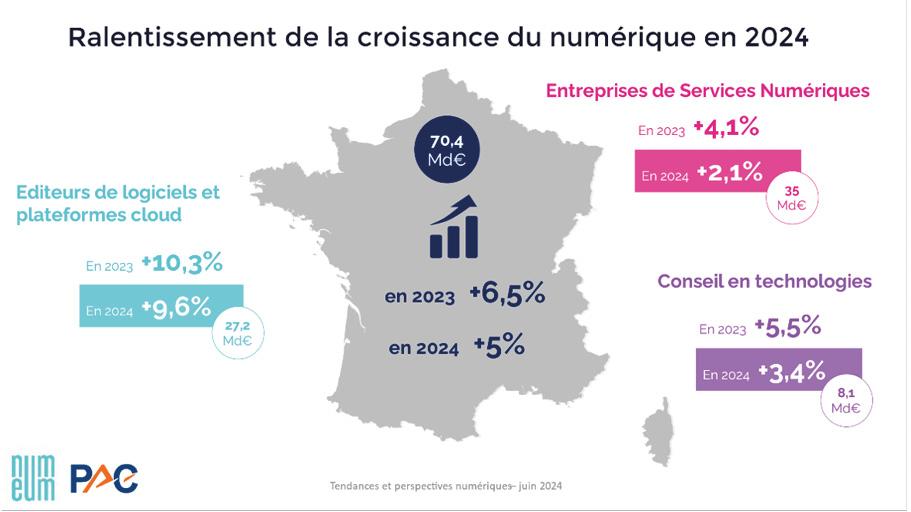
Numeum's Biannual Market Barometer for IT service companies and ICTs

Solutions to Address the Business Challenges of IT Services Companies
Testez l’expérience.